That's the problem conversion rate optimization (CRO) solves. Rather than throwing more money at traffic, CRO focuses on getting more value from the visitors you already have. Fix the right friction points, and the same traffic generates meaningfully more revenue.
This guide covers everything aspiring store owners need to act on: what CRO actually is, what realistic benchmarks look like, and the highest-impact strategies across site foundations, product pages, checkout, and testing.
Key Takeaways
- Average ecommerce conversion rates are 2.03% — but food/beverage stores hit 6.22% while luxury trails at 0.94%, so category benchmarks matter
- 70.22% of carts are abandoned — unexpected costs and forced account creation drive most of those exits
- A site loading in 1 second converts at 2.5x the rate of one loading in 5 seconds
- 98% of shoppers say reviews are essential before purchasing
- CRO is a continuous cycle that compounds results over time
What Is Ecommerce Conversion Rate Optimization (and Why It Matters)?
CRO is the systematic process of increasing the percentage of website visitors who complete a desired action — most commonly, making a purchase. It's data-driven and applies to the entire funnel from homepage to order confirmation.
The formula is simple:
Conversion Rate = (Conversions ÷ Visitors) × 100
So if 200 out of 10,000 visitors buy, your conversion rate is 2%.
CRO vs. Buying More Traffic
Here's why CRO often beats increasing ad spend:
- Compounds immediately — a better conversion rate makes every existing visitor more valuable
- Lowers acquisition costs — you need fewer visitors to hit the same revenue target
- Improves ROI without increasing budget — the math works in your favor from day one
That same logic extends to what happens before checkout. Most stores track micro-conversions — add-to-carts, wishlist saves, email sign-ups — as early signals that the funnel is healthy. When these numbers drop, they pinpoint exactly where to intervene before revenue takes a hit.
What Is a Good Ecommerce Conversion Rate?
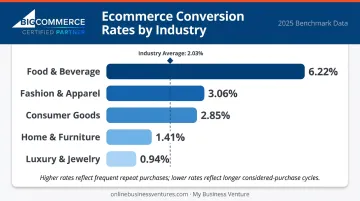
According to IRP Commerce's June 2026 market data, the overall average ecommerce conversion rate is 2.03%. But that number means very little without category context.
Conversion Rates by Industry (2026)
| Category | Conversion Rate |
|---|---|
| Food & Beverage | 6.22% |
| Fashion & Apparel | 3.06% |
| Consumer Goods | 2.85% |
| Home & Furniture | 1.41% |
| Luxury & Jewelry | 0.94% |
Source: Shopify / Dynamic Yield, trailing 12 months
The gaps are significant. Food and beverage converts high because purchases are familiar and repeatable — shoppers don't agonize over a $12 candle the way they do over a $1,200 sofa. Luxury purchases involve longer research cycles, often unfolding across multiple sessions or devices before a buyer commits.
Why Chasing an Industry Number Can Mislead You
A store moving from 1.2% to 1.8% has achieved a 50% improvement — regardless of where competitors sit. That's the benchmark that matters most: your own historical performance, trending upward.
Once you accept that internal progress beats external comparison, the next question becomes: where exactly are you losing buyers? In most stores, a small number of friction points — concentrated in product pages and checkout — account for the majority of lost conversions. Identifying those specific gaps will move your rate faster than any benchmark ever will.
Build a Conversion-Ready Store Foundation
CRO tactics only work when the underlying infrastructure is solid. Get these fundamentals right first — everything else builds on them.
Site Speed
Portent's ecommerce research found that a page loading in 1 second converts at 2.5x the rate of one loading in 5 seconds. Slow pages don't just frustrate visitors — they kill sales before a shopper ever reaches the product page.
Practical targets:
- Aim for a Time to First Byte (TTFB) under 200ms
- Core Web Vitals should be in the "good" range across mobile and desktop
- Compress images without sacrificing quality — they're usually the heaviest assets
Mobile Optimization
Smartphones drove 56.4% of US holiday online spend in 2025, according to Adobe Analytics data covering 1 trillion visits to US retail sites. Yet mobile conversion rates (2.3%) still trail desktop (2.6%), per Statista's December 2024 data — meaning mobile traffic is massive but under-converting.
Every element of the shopping experience must work on a small screen:
- Buttons large enough to tap accurately
- Images that scale without distortion
- Checkout simplified — fewer steps, large input fields, minimal typing
Trust Signals at the Store Level
Shoppers make split-second trust decisions before reading a single product description. SSL (the padlock in the browser bar), visible secure checkout indicators, and trust badges all send subconscious signals that this is a safe place to buy.
For entrepreneurs starting with a professionally built platform, many of these foundations come pre-configured. My Business Venture's turn-key BigCommerce stores, for example, include SSL security, encrypted checkout, trust badges, and mobile-optimized design from day one — so first-time store owners aren't troubleshooting security setup when they should be focused on selling.
Intuitive Navigation
Categories should reflect how shoppers think, not how inventory is organized internally. If a customer looking for "pet gifts" has to navigate through three ambiguous menu levels, they leave.
Effective navigation structures typically include:
- Top-level categories matching common search intent (e.g., "Gifts," "Pet Items," "Home & Office")
- Filters by price, brand, or product type on category pages
- A visible search bar with predictive suggestions
- Breadcrumb trails so shoppers always know where they are
Optimize Product Pages to Drive Add-to-Carts
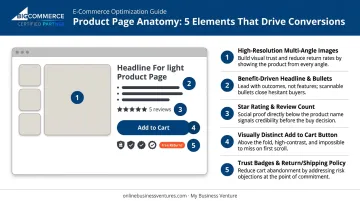
The product page is where buying decisions actually happen. Most stores underinvest here. The four areas below address the gaps that cost stores the most conversions.
Product Photography
Baymard Institute found that 56% of shoppers' first action on a product page is exploring images — before reading descriptions or reviews. Yet 25% of benchmarked ecommerce sites provided insufficient image resolution or zoom capability.
What works:
- Multiple angles, not just one front-facing shot
- Zoom functionality for detail-oriented categories
- In-scale or lifestyle images that show the product in real-world use
- High resolution — pixelated images signal low quality before a shopper reads a word
Benefit-Driven Product Descriptions
There's a meaningful difference between listing features ("14-inch nylon strap") and communicating benefits ("comfortable enough to wear all day without adjusting"). Baymard's usability research found that structuring descriptions around scannable "highlights" increased user engagement — yet 78% of benchmarked sites didn't use this format.
Effective product descriptions:
- Lead with the outcome or benefit the customer cares about
- Use bullet points for quick scanning
- Answer the most likely objections in the copy itself
- Avoid dense paragraphs — they get skipped
Customer Reviews and Social Proof
PowerReviews' 2023 survey of 8,153 US consumers found that 98% said reviews were an essential purchase resource and 45% would not buy a product with no reviews at all.
For newer stores, even a handful of reviews changes the dynamic. Spiegel Research Center data shows purchase likelihood for a product with just five reviews is 270% higher than for one with none. Display both the average star rating and the total review count — volume matters as much as the score.
CTA and Trust Signals at the Point of Decision
The "Add to Cart" button must be:
- Above the fold without scrolling
- Visually distinct — contrasting color, clear label
- Not competing with surrounding design noise
Place your return policy, shipping details, and security badges directly beside the CTA — shoppers want that confirmation before they click, not after they go looking for it.
Reduce Checkout Friction and Recover Abandoned Carts
The Scale of the Problem
Baymard's 2026 aggregate data puts the average cart abandonment rate at 70.22%. That's roughly seven out of every ten shoppers who showed purchase intent walking away.
The most common reasons (Baymard, 2025):
| Reason | % of Abandoners |
|---|---|
| Extra costs too high (shipping, taxes) | 39% |
| Forced account creation | 19% |
| Checkout too long or complicated | 18% |
| Insufficient payment methods | 10% |
Each of these is fixable.
Streamline the Checkout Form
Baymard's 2024 benchmark found the average US checkout displays 23.48 form elements — when most need only 12–14. The impact is real: every unnecessary field increases the chance a shopper gives up.
Practical fixes:
- Enable guest checkout — don't force account creation
- Reduce form fields to only what's essential
- Enable autofill wherever possible
- Clearly distinguish required vs. optional fields
Payment Methods and Trust at the Payment Step
Digital wallets accounted for 53% of global ecommerce spend in 2024 (Worldpay), and BNPL transaction value reached $342 billion. These are mainstream expectations now, not niche preferences.
At minimum, your checkout should support:
- Credit and debit cards
- At least one major digital wallet (Apple Pay, Google Pay, PayPal)
- BNPL options for higher-ticket categories — each accepted method removes a reason not to buy
At the payment screen, reinforce trust with SSL indicators, security badges, and visible return/refund policy language near the payment form. Perceived security drives behavior as much as actual security does.
MBV stores come with a fully configured merchant account and secure payment gateway across all package tiers — clients can accept card payments from day one, without separate processor negotiations.
Cart Abandonment Recovery
Abandoned cart emails remain one of the highest-ROI tools available. Klaviyo's 2024 analysis of 143,000+ flows reported a median open rate of 50.5% and a placed-order rate of 3.33% — with top performers reaching 7.69%.
A simple three-email sequence:
- Email 1 (1–2 hours after abandonment) — reminder with the specific abandoned item, no pressure
- Email 2 (24 hours later) — address common objections; highlight return policy or free shipping
- Email 3 (48–72 hours later) — time-limited incentive (discount code, free shipping offer)
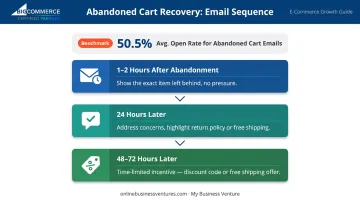
Personalization with the actual product left behind consistently outperforms generic "you forgot something" messaging.
MBV store owners have a structural edge here: free shipping is built into the dropship model, so unexpected costs at checkout — the single largest abandonment trigger — never come up in the first place.
Test, Measure, and Iterate: Building a Sustainable CRO Process
Analytics First
You can't improve what you don't measure. The key metrics every store should track:
- Unique visitors
- Add-to-cart rate
- Checkout initiation rate
- Checkout completion rate
- Cart abandonment rate
- Average order value (AOV)
MBV stores include a built-in Google Analytics dashboard in the admin portal, giving store owners a baseline for tracking these metrics from launch.
A/B Testing Fundamentals
A/B testing is the primary CRO methodology — it separates assumptions from evidence. Even changes that seem obviously better (a new headline, a different button color) need real traffic data to validate.
Basic rules:
- Test one variable at a time — otherwise you can't attribute the result
- Run tests for at least two weeks to reach statistical significance
- Don't end a test early because early results look promising
Small wins compound. A 10% lift in add-to-cart rate plus a 10% reduction in checkout abandonment doesn't add up to 20% more revenue — it multiplies.
Prioritization Framework
Score potential improvements across three dimensions:
- Impact — how much revenue could this move?
- Funnel importance — is this a high-traffic, high-drop-off point?
- Implementation effort — how hard is this to test?
Tackle high-impact, low-effort changes first. Product page improvements and checkout simplifications typically sit in this category. History-of-the-brand pages and homepage redesigns rarely do.
That prioritization gets sharper as data builds. MBV University coaching sessions and one-on-one consultant access help store owners identify which tests to run next — and which changes are worth the effort at each stage of growth.
The stores that improve consistently aren't running more tests. They're running the right ones.
Frequently Asked Questions
How do I improve the conversion rate of my ecommerce store?
Start with the highest-impact areas: product pages, checkout, site speed, and mobile experience. Add social proof (reviews, trust badges), eliminate checkout friction (guest checkout, fewer form fields), and use A/B testing to validate changes before rolling them out permanently.
What is a good conversion rate for ecommerce?
Industry averages range from 0.94% (luxury/jewelry) to 6.22% (food/beverage), with an overall average around 2.03%. The most meaningful benchmark isn't competitor data — it's improvement over your own historical performance.
What is the 80/20 rule in ecommerce?
In most stores, roughly 20% of friction points — concentrated in product pages and checkout — account for 80% of lost conversions. Fixing those bottlenecks first delivers far greater returns than spreading effort across the entire site.
What causes visitors to leave without buying?
The most common culprits: unexpected shipping costs, forced account creation, slow page load times, confusing navigation, insufficient trust signals, and product pages that don't answer key purchase questions. Addressing even two or three of these can produce a measurable lift in conversions.
How do I know which pages to optimize first?
Use analytics to find high-traffic pages with elevated drop-off rates — typically product detail pages and the checkout flow. Improvements on these pages directly impact revenue, making them the highest-leverage starting point.
Does free shipping improve ecommerce conversion rates?
Consistently, yes. Unexpected shipping costs are cited by 39% of checkout abandoners as their primary reason for leaving. A clear free shipping offer — either on all orders or above a stated threshold — removes the most common objection at the most critical moment.