What Are Marketing Metrics and Why Do They Matter?
You've launched your online store. Google Analytics is open in one tab, your Facebook Ads dashboard in another, your email platform in a third. Numbers everywhere — impressions, sessions, open rates, followers — and yet you have no clear sense of whether any of it is working.
That's the core problem with marketing data: having too much of it can feel just as paralyzing as having none.
Marketing metrics are the quantifiable measurements that tell you whether your marketing is driving real business results. Without them, every decision — which ad to run, which email to send, where to spend next month's budget — is educated guesswork.
One distinction shapes everything else: outputs versus outcomes. Outputs are what you produce — emails sent, ads published, posts scheduled. Outcomes are what you actually achieve — customers acquired, revenue generated, repeat purchases made. The right metrics connect activity to outcomes. They don't just count the work; they measure what the work produces.
This guide covers 31 marketing metrics organized across five categories: foundation, e-commerce/website, email, digital advertising, and social media/lead generation. You'll also learn which popular numbers are vanity metrics that can actively mislead rather than guide.
Key Takeaways
- Marketing metrics reveal whether your efforts are producing real business results, not just activity
- Choosing the wrong metrics means optimizing for the wrong goals
- This guide covers 31 metrics across five practical categories
- Vanity metrics look impressive but don't connect to revenue — knowing what to ignore is just as important as knowing what to track
- New store owners should start with 3–5 core metrics tied to where their store is right now
The 5 Foundation Marketing Metrics Every Business Owner Should Know
These five metrics form the strategic backbone of any marketing program. They apply regardless of channel, industry, or business size — and they provide the clearest signal of overall marketing health.
Customer Lifetime Value (CLV)
CLV is the total revenue a business can expect from a single customer over the entire relationship. A customer who buys once for $50 is very different from one who buys monthly for years. Increasing CLV through repeat purchases reduces the constant pressure to acquire new customers — which is where most small businesses burn their budgets.
Customer Acquisition Cost (CAC)
How much does it actually cost to win a customer? That's what CAC answers: total marketing and sales spend ÷ number of new customers acquired in a given period. Shopify's 2025 data shows CAC varies sharply by category for small e-commerce brands — $21 for arts and entertainment, $127 for health and beauty, $377 for electronics. High CAC relative to revenue per customer is a warning sign the model may not be sustainable.
CLV to CAC Ratio
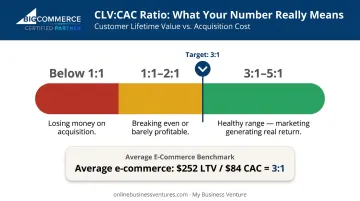
Neither CLV nor CAC is meaningful alone — their ratio reveals whether marketing generates a positive return.
| Ratio | What It Means |
|---|---|
| Below 1:1 | You're spending more to acquire customers than they'll ever return |
| 1:1 – 2:1 | Breaking even or barely profitable |
| 3:1 or higher | Generally healthy — marketing is generating real return |
According to HubSpot, a 3:1 LTV:CAC ratio is a solid benchmark, with 3:1 to 5:1 considered the healthy range for established companies. Their data places average e-commerce at exactly that 3:1 mark ($252 average LTV, $84 CAC).
Once you know your CAC and CLV are in a healthy ratio, ROI ties it all together for stakeholders.
Marketing Return on Investment (ROI)
Marketing ROI = (revenue from marketing – cost of marketing) ÷ cost of marketing × 100. This is the single metric most likely to justify marketing budgets to leadership or investors. The challenge is attribution — accurately connecting specific activities to specific sales is difficult across multiple channels, but even a rough ROI figure is more useful than none.
Net Promoter Score (NPS)
NPS measures how likely customers are to recommend your business to others, scored 0–10. Respondents fall into three groups:
- Promoters (9–10): Loyal advocates who actively refer others and drive organic growth
- Passives (7–8): Satisfied but unlikely to recommend without prompting
- Detractors (0–6): Unhappy customers who may leave negative reviews or warn others away
For e-commerce brands that depend on reviews and word-of-mouth, a high NPS is a strong predictor of organic growth that doesn't require additional ad spend to sustain.
7 E-Commerce and Website Metrics That Drive Online Sales
These metrics live at the intersection of traffic and revenue. They reveal how well your website turns visitors into buyers — and that conversion gap is where online stores are won or lost.
MBV's turn-key e-commerce stores, built on the BigCommerce platform, include a built-in Google Analytics dashboard within the admin portal, giving new store owners a data foundation from day one without needing to configure tracking from scratch.
Conversion Rate
Conversion rate = (conversions ÷ total visitors) × 100. This is the most important e-commerce metric because it reflects the combined effectiveness of traffic quality, product appeal, pricing, and site usability — all in one number.
Statista's December 2024 data across 250+ retail brands puts the worldwide average at 2.4% (2.6% on desktop, 2.3% on mobile). Category matters a lot: food and beverage sites can reach 6%+, while luxury and jewelry often fall below 1%.
Average Order Value (AOV) and Cart Abandonment Rate
AOV = total revenue ÷ number of orders. Improving AOV through upsells, bundles, or free shipping thresholds increases revenue without requiring more traffic — one of the highest-leverage levers in e-commerce.
Cart abandonment rate measures the percentage of shoppers who add items to their cart but never complete the purchase. The Baymard Institute, averaging 50 separate studies, puts the figure at 70.22% — meaning roughly seven out of every ten carts are abandoned. That's a significant revenue leak worth understanding before you optimize anything else.
Revenue Per Visitor and Returning Visitors
Two metrics worth pairing:
- Revenue Per Visitor (total revenue ÷ total visitors) captures both conversion rate and AOV in one number, useful for comparing performance across channels. High traffic with low Revenue Per Visitor signals a quality problem, not a volume one.
- Returning Visitors — the share of visitors who've been to your store before — signals brand loyalty. A healthy returning visitor rate suggests your CLV potential is growing alongside traffic.
Bounce Rate and Time on Page
Bounce rate is the percentage of visitors who leave after viewing only one page without taking any action. On a product page, a high bounce rate signals misalignment between the ad that drove the click and what the visitor actually found.
Time on Page is the average amount of time visitors spend on a given page. Longer time on a product page often correlates with higher purchase intent. Very short time — a few seconds — usually means the page didn't connect with the visitor at all.
6 Email Marketing Metrics Worth Tracking
Email is one of the highest-ROI marketing channels available to e-commerce businesses. Litmus reports an average of $36 returned per $1 spent on email marketing — but only if you're tracking the right metrics. Raw subscriber count tells you almost nothing useful.
Open Rate and Click-Through Rate
Open rate is the percentage of recipients who open an email. It's the baseline indicator of whether your subject lines and sender reputation are doing their job. Mailchimp's December 2023 data puts the average open rate across industries at 29.81%.
Email Click-Through Rate (CTR) is the percentage of email recipients who click a link within the email — a stronger signal of genuine interest than an open alone. Tracking both together pinpoints where revenue is leaking: low opens point to a subject line or deliverability problem, while low CTR means the email itself isn't compelling enough to act on.
Conversion Rate, Unsubscribe Rate, and Email Bounce Rate
Three metrics that need to be watched together:
- Email Conversion Rate: The percentage of recipients who complete the intended action after clicking through — the metric most directly tied to revenue
- Unsubscribe Rate: A high rate signals a mismatch between content and audience expectations, and can trigger spam filters that damage deliverability for future campaigns
- Email Bounce Rate: Hard bounces (invalid addresses) and soft bounces (temporary delivery failures) both hurt sender reputation — neglecting list hygiene will erode deliverability across every campaign you send
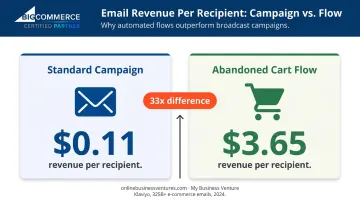
Klaviyo's 2024 data from 325 billion+ e-commerce emails shows the revenue impact of getting email right: standard campaigns average $0.11 revenue per recipient, while abandoned cart flows generate $3.65 per recipient — a 33x difference.
List Growth Rate
List Growth Rate = (new subscribers – unsubscribes and bounces) ÷ total list size. A stagnant or shrinking list means your email channel's revenue ceiling is declining — even if open and conversion rates stay strong. Aim to offset churn with a consistent acquisition strategy — lead magnets, exit-intent popups, and post-purchase opt-ins are reliable starting points.
6 Digital Advertising Metrics to Monitor on Paid Campaigns
Paid advertising is often the fastest way for new e-commerce store owners to generate early sales. It's also the fastest way to lose money if you're watching the wrong numbers. These six metrics apply across Google Ads, Facebook/Instagram Ads, and most other pay-per-click platforms.
Cost-Per-Click (CPC) and Click-Through Rate (CTR)
CPC is the amount paid each time a user clicks a paid ad — the most fundamental advertising cost metric.
Ad CTR is the percentage of users who see an ad and click it. Higher CTR typically means your ad creative and targeting are aligned. It also tends to lower your CPC: platforms like Google reward relevance, so better CTR usually means cheaper clicks.
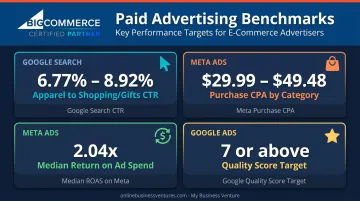
WordStream's 2025 data from 16,446 US campaigns shows Google Search CTR of 6.77% for apparel/fashion and 8.92% for shopping/gifts — useful benchmarks for e-commerce advertisers.
CPM and Cost Per Acquisition (CPA)
CPM (Cost Per Thousand Impressions) is the cost to show an ad 1,000 times. It's relevant for brand awareness campaigns where reach matters more than clicks.
Once awareness builds, the metric that matters is CPA — total ad spend ÷ number of customers acquired. It's the most direct link between advertising spend and actual customers, making it essential for evaluating whether a campaign is profitable. Triple Whale's 2025 data across nearly 35,000 e-commerce brands shows Meta purchase CPA ranging from $29.99 to $49.48 depending on retail category.
Return on Ad Spend (ROAS) and Quality Score
ROAS = revenue generated from advertising ÷ cost of that advertising. For every dollar spent on ads, how many dollars came back? Triple Whale reports a 2.04 median ROAS for e-commerce brands in 2024 — meaning the average store earned about $2 for every $1 spent on Meta ads.
Quality Score (primarily a Google Ads metric) is the platform's aggregate rating of ad relevance, expected CTR, and landing page experience. A low Quality Score directly increases your ad costs; a high score reduces them. Google scores ads on a 1–10 scale — anything above 7 typically earns a cost discount.
Quick benchmark reference for paid campaigns:
- Google Search CTR: 6.77% (apparel) to 8.92% (shopping/gifts)
- Meta purchase CPA: $29.99–$49.48 depending on category
- Median e-commerce ROAS on Meta: 2.04x
- Google Quality Score target: 7 or above
Social Media and Lead Generation: 7 Metrics for Audience and Pipeline Growth
Social media metrics and lead generation metrics both operate in the pre-purchase phase — they measure how well you're building awareness and interest before someone is ready to buy. Social media in particular is littered with vanity metrics. The ones below are chosen specifically because they connect more directly to actual business outcomes.
Social Media: Engagement Rate, Reach, and Virality Rate
- Engagement Rate: The percentage of an audience that interacts with content (likes, comments, shares, saves). It's more meaningful than raw counts because it accounts for audience size, making cross-account comparisons accurate. Hootsuite's 2026 data shows platform averages: Instagram 4.04%, LinkedIn 3.56%, Facebook 2.08%, TikTok 1.71%
- Reach: The number of unique users who saw a piece of content — distinct from impressions, which count every view including repeat views by the same person. For comparing campaign performance, reach is the more honest number
- Virality Rate: Shares or reposts per piece of content relative to reach. It identifies which content resonates strongly enough that your audience does your distribution for you
Lead Generation: MQLs, SQLs, and Cost Per Lead
- Marketing Qualified Leads (MQLs): Prospects who have shown meaningful interest — downloading a resource, signing up for a newsletter, repeatedly visiting the site — but aren't yet ready to buy. MQLs measure how well top-of-funnel marketing is filling the pipeline
- Sales Qualified Leads (SQLs): Leads confirmed as likely buyers. The MQL-to-SQL conversion rate reveals pipeline quality — how many interested prospects are actually ready to purchase
- Cost Per Lead (CPL): Total marketing spend ÷ number of leads generated. This metric separates the cost of generating interest from the cost of closing a sale, helping you evaluate channel efficiency before purchase intent enters the picture
5 Vanity Metrics to Stop Obsessing Over
A vanity metric isn't a useless number — it's a number that looks impressive on a dashboard but doesn't meaningfully connect to revenue, customer acquisition, or strategic goals. The real danger is that optimizing for them can actively work against real business outcomes.
Here's a simple test: if this number doubled but nothing else changed, would our business be better off? If the answer is unclear, it's probably a vanity metric.
Impressions, Followers, and Likes
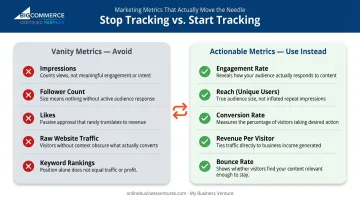
Raw impressions (total ad or content views), follower count, and social media likes are the classic vanity metrics. All three can be artificially inflated — through paid promotion, follow-for-follow tactics, or content engineered for low-effort engagement. None inherently translate to revenue.
A business could have 200,000 followers with near-zero sales if those followers are the wrong audience. Liking a brand on social media rarely changes purchasing behavior unless that brand uses paid reach to act on it.
Replace these with: Engagement Rate, Reach (unique users), and Conversion Rate.
Raw Website Traffic and Keyword Rankings
High traffic from irrelevant sources (wrong keywords, untargeted promotion) can actually signal poor site quality to search engines when visitors immediately leave. Similarly, ranking for broad, high-volume keywords that don't match buyer intent generates traffic that rarely converts.
Neither number tells you whether the right people are finding you.
Replace these with: Conversion Rate, Revenue Per Visitor, and Bounce Rate — metrics that give raw traffic figures the context they need to be actionable.
Frequently Asked Questions
What are the 5 most important marketing metrics?
The five most universally important are Conversion Rate, Customer Acquisition Cost (CAC), Marketing ROI, Customer Lifetime Value (CLV), and Click-Through Rate (CTR). The right five will vary based on your specific channel and current business stage.
What is the difference between a marketing metric and a KPI?
All KPIs are marketing metrics, but not all marketing metrics are KPIs. A KPI is a specific metric elevated to a primary goal indicator for a campaign or period. Marketing metrics is the broader term for any measurable data point used to evaluate performance.
How do I know which marketing metrics to prioritize for my new online store?
Start with 3–5 metrics directly tied to your current goal. If you're focused on driving first sales, start with Conversion Rate, Revenue Per Visitor, and CAC. Expand your tracking as the business grows rather than trying to monitor everything at once.
What are vanity metrics, and why should I avoid them?
Vanity metrics are numbers that look impressive but don't directly connect to revenue or strategic goals. Total followers, raw impressions, and website traffic without conversion context are the most common examples. Optimizing for them wastes resources and pulls focus from the numbers that actually move revenue.
What tools can I use to track marketing metrics for my e-commerce business?
Most major platforms include built-in analytics: Google Analytics for website data, native dashboards for social media and paid ads, and your email service provider for email metrics. E-commerce platforms like BigCommerce include native reporting tools as well. MBV store owners, for example, access a Google Analytics dashboard directly from their store admin portal from day one.
What is a good conversion rate for an e-commerce website?
The worldwide average is approximately 2.4% based on December 2024 data, though it ranges from under 1% (luxury goods) to over 6% (food and beverage). More useful than chasing industry benchmarks is tracking your own baseline over time and improving against it consistently.